Error loading page.
Try refreshing the page. If that doesn't work, there may be a network issue, and you can use our self test page to see what's preventing the page from loading.
Learn more about possible network issues or contact support for more help.
1 of 1 copy available
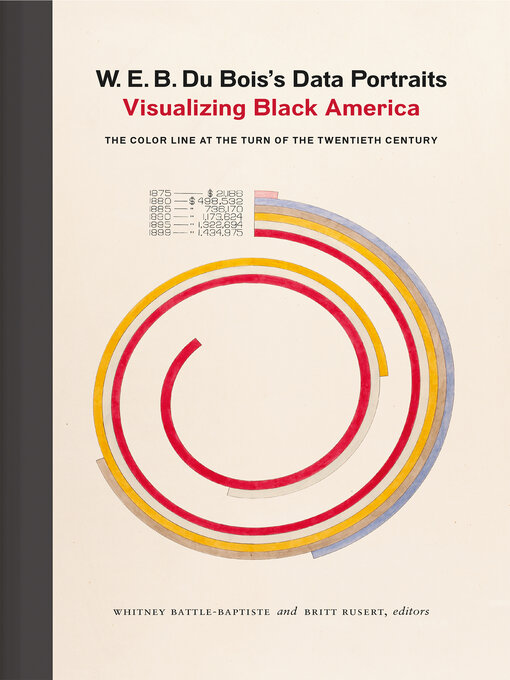
The colorful charts, graphs, and maps presented at the 1900 Paris Exposition by famed sociologist and black rights activist W. E. B. Du Bois offered a view into the lives of black Americans, conveying a literal and figurative representation of "the color line." From advances in education to the lingering effects of slavery, these prophetic infographics —beautiful in design and powerful in content—make visible a wide spectrum of black experience.
W. E. B. Du Bois's Data Portraits collects the complete set of graphics in full color for the first time, making their insights and innovations available to a contemporary imagination. As Maria Popova wrote, these data portraits shaped how "Du Bois himself thought about sociology, informing the ideas with which he set the world ablaze three years later in The Souls of Black Folk."
  • Creators

  • Publisher

  • Release date

  • Formats

  • Languages

  • Reviews

    • Booklist

      November 15, 2018
      In 1900, renowned black sociologist and civil-rights leader Du Bois created more than 60 charts, graphs, and maps for an exhibit on African American life at the Exhibition Universelle in Paris. The American Negro Exhibit, presented just 30 years after the official abolition of slavery, contained two series of data visualizations: a case study of Georgia's black population that depicted African American progress after the Civil War, and a broader picture of African American life using national statistical data such as employment and literacy rates. Introductory essays by Du Bois scholars provide context for the exhibition and the work of his Atlanta University school of sociology, with captions by an art-and-design scholar that situate the work within design history. But the infographics themselves, presented as full-page color plates, ultimately speak for themselves. Whether as traditional bar charts or in experimental presentations such as spirals and interwoven bars, Du Bois' data visualizations convey the power of information design and "infographic activism." Recommended for academic libraries that support programs in art and design, sociology, or African American studies.(Reprinted with permission of Booklist, copyright 2018, American Library Association.)

Formats

  • Kindle Book
  • OverDrive Read
  • EPUB ebook

Languages

  • English

Loading